Links
Other science mapping softwares & tools
Science mapping can be carried out with many, many different softwares. Among the different lists of ressources and softwares that can be found online, I especially recommand:
- François Briatte's awesome list of resources to construct, analyze and visualize network data (general tools, not limited to scientometrics).
- Hamid Jamali's scientometric portal, a gateway to scientometric-related materials and resources.
Projects featuring BiblioTools / BiblioMaps
Here are links to papers and projects websites examplifying what can be achieved with BiblioTools.
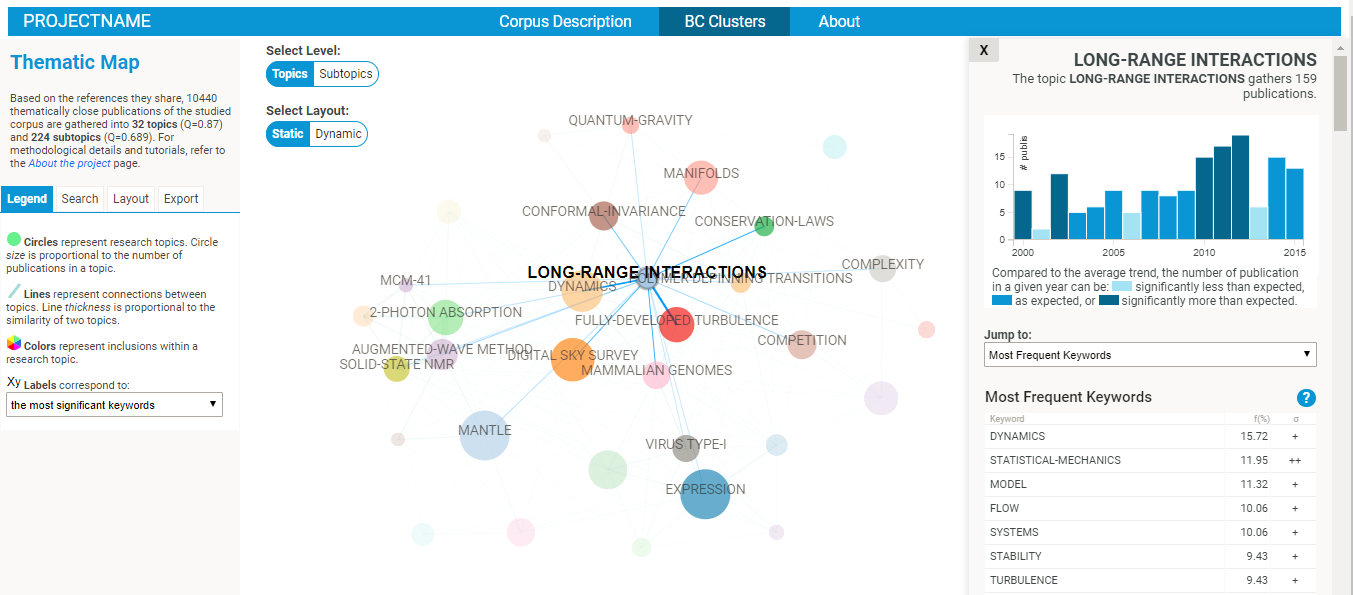 |
⇒ ENS Lyon Research Maps, a temporary webpage presenting the latest version of the BiblioMaps interface based on the analysis of ∼ 11700 publications from the ENS Lyon. |  |
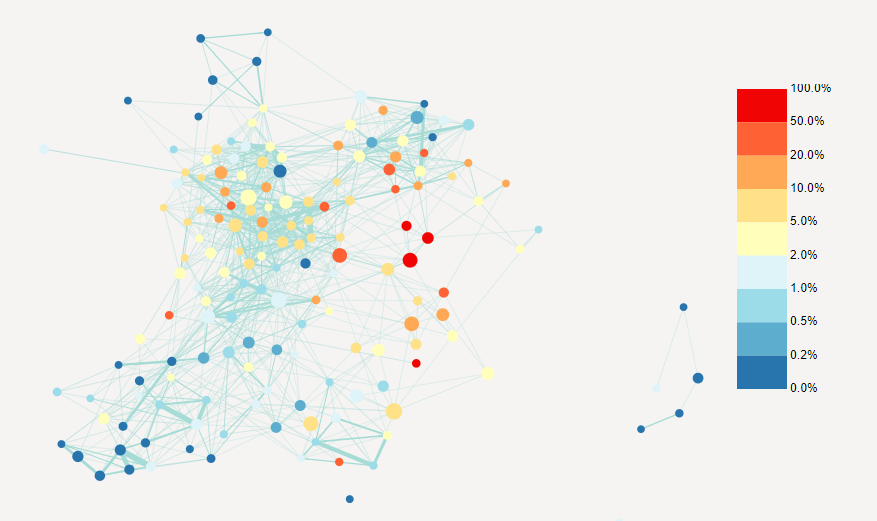
⇒ Digital Promise's Research Map, visualizing topics within education research, was specifically designed to be used by educators / a general audience. This map was built for and in collaboration with Digital Promise - a US non-profit organization working on spurring innovation in education through technology and research - and first released in 2016. A huge effort of interpretation of the topics found by the bibliometric coupling analysis was done by experts in the field, who delivered short reviews on each of these topics, detailing their key findings and providing links to relevant online materials. |
 |
⇒ The EducMap research project, in collaboration with researchers from the Laboratoire de l'Education (LLE), aims at a better understanding of the communities working in the field of research in education thanks to the exploration of maps based on bibliographic data. In this project, we investigate various questions regarding the topics of research in education: their nature, their interconnection, their links to other bodies of research in the natural and social sciences, their evolution, etc. |
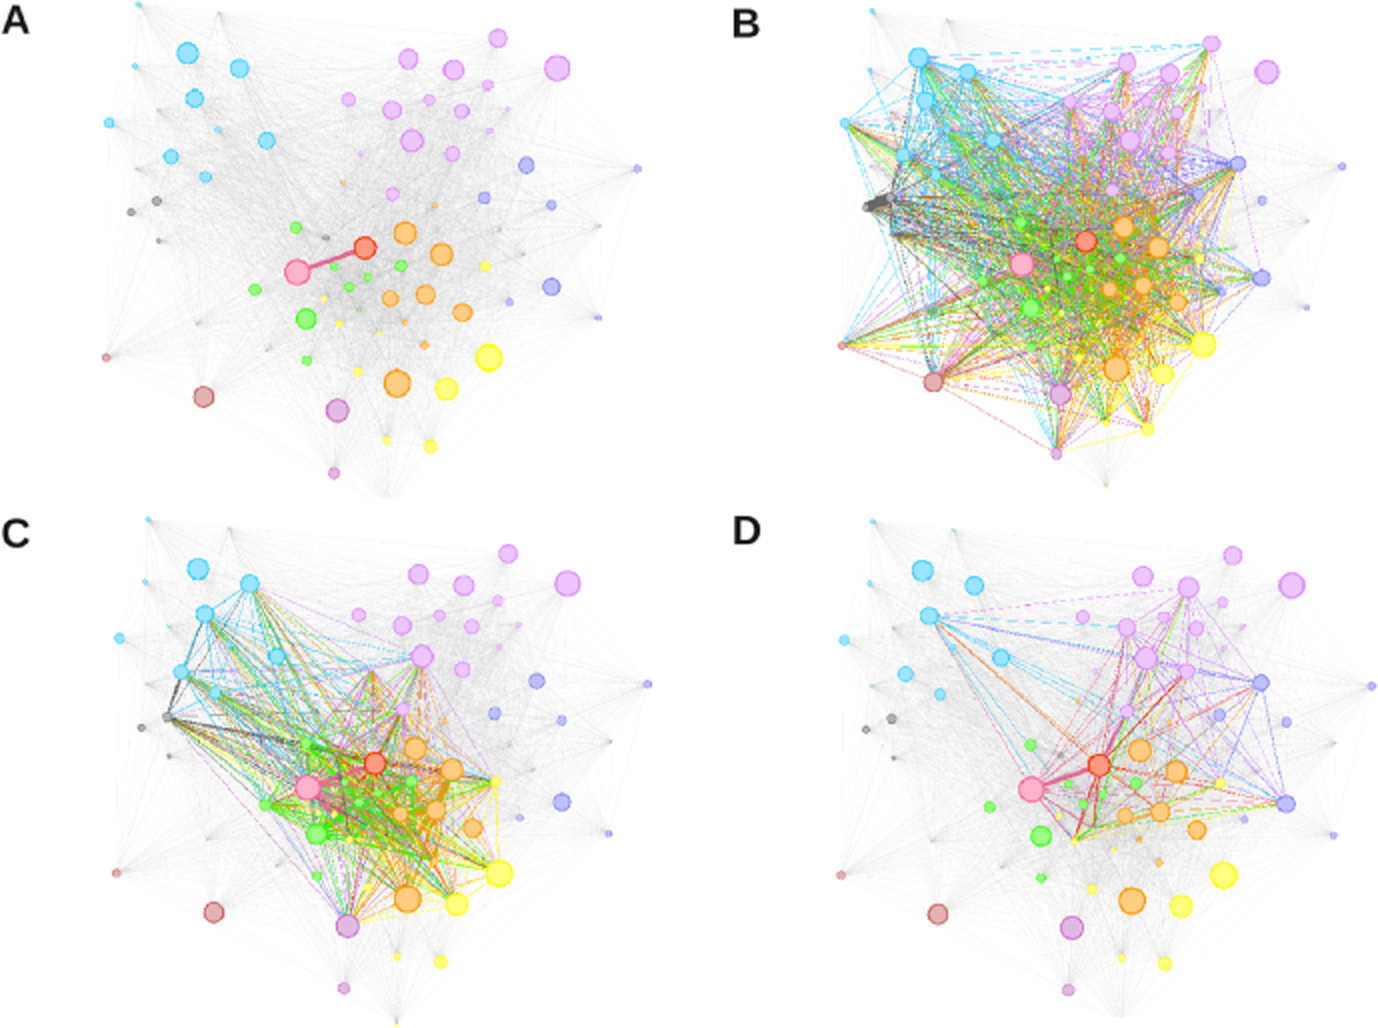 |
⇒ Paper [online version, arxiv version] focused on the representation and analysis of an emerging scientific field. S Grauwin et al. Complex systems science: dreams of universality, reality of interdisciplinarity. Journal of the American Society for Information Science and Technology (2012). Abstract. Using a large database (∼ 215,000 records) of relevant articles, we empirically study the complex systems field and its claims to find universal principles applying to systems in general. The study of references shared by the articles allows us to obtain a global point of view on the structure of this highly interdisciplinary field. We show that its overall coherence does not arise from a universal theory, but instead from computational techniques and fruitful adaptations of the idea of self-organization to specific systems. We also find that communication between different disciplines goes through specific “trading zones,” i.e., subcommunities that create an interface around specific tools (a DNA microchip) or concepts (a network). |
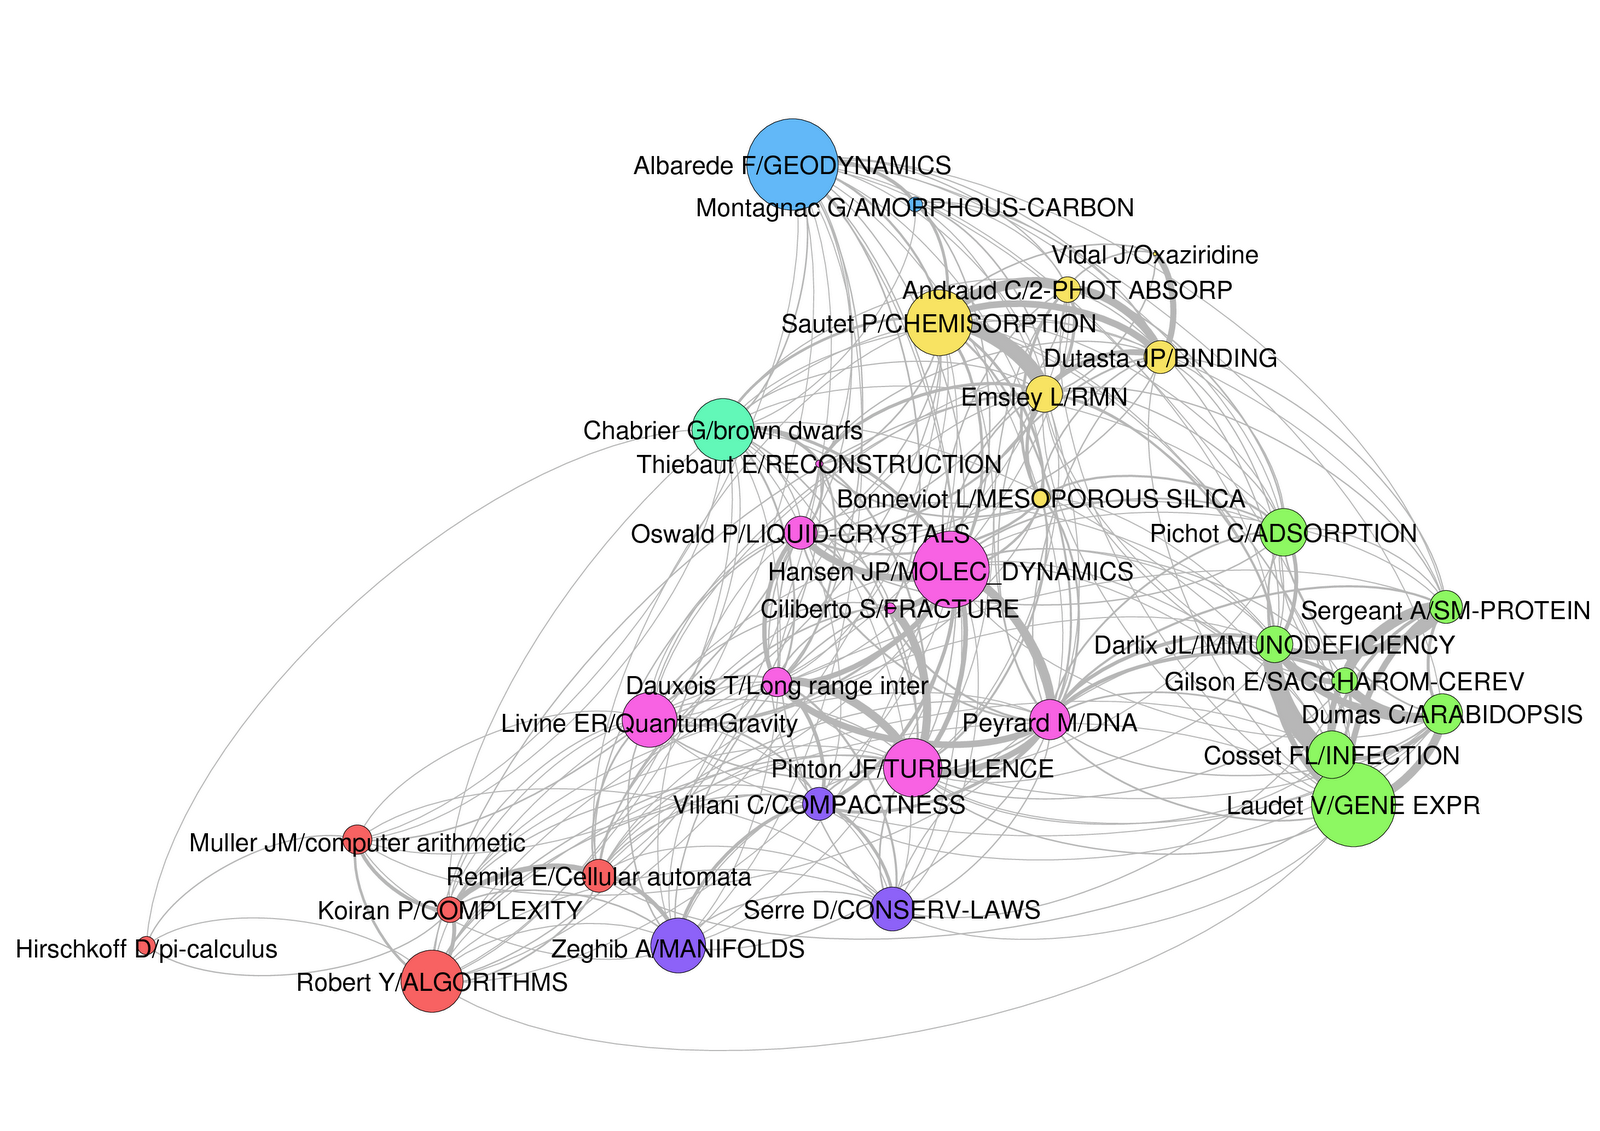 |
⇒ Paper [online version] presenting the first version of BiblioTools, focused on the representation of a scientific institution. S Grauwin, P Jensen, Mapping Scientific Institutions. Scientometrics 89(3), 943-954 (2011). Abstract. We have developed a set of routines that allows to draw easily different maps of the research carried out in a scientific institution. Our toolkit uses OpenSource elements to analyze bibliometric data gathered from the Web Of Science. We take the example of our institution, ENS de Lyon, to show how different maps, using co-occurrence (of authors, keywords, institutions…) and bibliographic coupling can be built. These maps may become a valuable tool for discussing institutions’ policies, as they offer different views on the institution at a global scale. |