Context
This website provides some materials related to a study investigating the development of instrumental orchestration over time and the way in which it is used and adapted in mathematics education research practices. This study is based on a literature review including bibliometric clustering techniques whose results were interpreted by the experience perspective of two experts in the field.
If you want more information about this study, you may refer to our paper: Drijvers P., Grauwin S., Trouche L. (2020). When bibliometrics met mathematics education research: the case of instrumental orchestration. [Link to be provided later]
Methodology
Corpus selection
The publications metadata were extracted from Scopus on August 28, 2019. Our goal being to map the scientific fields where Instrumental Orchestration may have had an impact, we built a succession of corpora by iteratively including the publications we could find in Scopus citing (at least) one of the previously selected publication.
- Core publications. We used the quering tool "TITLE-ABS-KEY", which looks among the title, abstract and keywords for specified words or expressions. The query TITLE-ABS-KEY("instrumental orchestration") OR TITLE-ABS-KEY("orchestration instrumentale"), hence yield 22 publications records. Two of these publications, dealing with musical analysis, were excluded from this list, leading to a "core corpus" of 20 publications dealing with Instrumental Orchestration.
- The "Layer 1" corpus consists of 235 publications: the core publications and all the publications citing them in Scopus.
- The "Layer 2" corpus consists of 1017 publications: the Layer 1 publications and all the publications citing them in Scopus.
- The "Layer 3" corpus consists of 4224 publications: the Layer 2 publications and all the publications citing them in Scopus.
Data cleaning
A semi-automatic algorithm was used to detect different variants of a same reference: author names with one or two initials, references sources variant , errors in the volumes, etc. In total, about 500 variant names of 150 sources were cleaned. For example:
- Some 15 name variants were identified for "COMPUTERS & EDUCATION" in the references from the metadata extrated from Scopus: "COMPUT. EDUC.", "COMPUT. EDUC", "COMPUT. EDU.", "COMPUT. EDU", "J. COMPUT. EDUC.", "COMPUTERS & EDUCATION.", "COMPUTER & EDUCATION", "COMPUTERS AND EDUCATION", "(2013) COMPUTERS & EDUCATION", "COMPUTERS & EDUCATIO", "COMPUTER AND EDUCATION", "COMPUTERS &EDUCATION", "COMPUTERS AND EDUCATIO", "COMP. EDUC", "COMPUT EDUC."
- 7 name variants were identified for the "JOURNAL OF THE LEARNING SCIENCES": "JOURNAL OF THE LEARNING SCIENCES", "THE JOURNAL OF THE LEARNING SCIENCES", "J. LEARN. SCI.", "J LEARN SCI", "J LEARN SCI.", "JOURNAL OF THE LEARNING SCIENCES."
- More than 40 name variants were identified for the ZDM Mathematics Education reference sources: "ZDM", "ZDM MATH EDUC.", "ZDM MATH. EDUC", "ZDM MATH. EDUC.", "ZDM. MATHEMATICS EDUCATION", "ZDM. ZENTRALBLATT FUR DIDAKTIK DER MATHEMATIK", "ZDM-THE INTERNATIONAL JOURNAL ON MATHEMATICS EDUCATION", "ZDM INT. J. MATH. EDUC.", "ZDM.", "ZDM. THE INTERNATIONAL JOURNAL ON MATHEMATICS EDUCATION", "ZDM: THE INTERNATIONAL JOURNAL ON MATHEMATICS EDUCATION", "ZDM--THE INTERNATIONAL JOURNAL ON MATHEMATICS EDUCATION", "ZDM THE INTERNATIONAL JOURNAL ON MATHEMATICS EDUCATION", "ZDM-INTERNATIONAL JOURNAL ON MATHEMATICS EDUCATION", "ZDM MATHEMATICS EDUCATIO", "ZDM-MATHEMATICS EDUCATION", "ZDM MATH EDUC", "ZDM: THE INTERNATIONAL JOURNAL OF MATHEMATICS EDUCATION", "ZDM - MATHEMATICS EDUCATION", "ZDM-THE INTERNATIONAL JOURNAL OF MATHEMATICS EDUCATION", "ZDM MATH. EDUC", "ZDM. THE INTERNATIONAL JOURNAL ON MATHEMATICS EDUCATION", "ZDM MATH. EDUC.", "ZDM. ZENTRALBLATT FUR DIDAKTIK DER MATHEMATIK", "ZDM- THE INTERNATIONAL JOURNAL ON MATHEMATICS EDUCATION", "ZDM - INTERNATIONAL JOURNAL ON MATHEMATICS EDUCATION", "ZDM THE INTERNATIONAL JOURNAL OF MATHEMATICS EDUCATION", "ZDM--INTERNATIONAL JOURNAL ON MATHEMATICS EDUCATION", "ZENTRALBLATT FUR DIDAKTIK DER MATHEMATIK (ZDM)", "ZENTRALBLATT FUER DIDAKTIK DER MATHEMATIK", "ZDM - THE INTERNATIONAL JOURNAL OF MATHEMATICS EDUCATION", "ZDM INTERNATIONAL JOURNAL ON MATHEMATICS EDUCATION", "ZDM-ZENTRALBLATT FUR DIDAKTIK DER MATHEMATIK", "ZDM: INTERNATIONAL JOURNAL ON MATHEMATICS EDUCATION", "ZDMMATHEMATICS EDUCATION", "INTERNATIONAL REVIEWS ON MATHEMATICAL EDUCATION (ZDM)", "ZENTRALBLATT FUR DIDAKTIK DER MATHEMATIK", "THE INTERNATIONAL JOURNAL ON MATHEMATICS EDUCATION (ZDM)", "ZDM- MATHEMATICS EDUCATION", "ZDM - THE INTERNATIONAL JOURNAL ON MATHEMATICS EDUCATION", "ZDM--THE INTERNATIONAL JOURNAL OF MATHEMATICS EDUCATION"
- etc...
This cleaning processes is performed in a semi-automatic way. It is NOT exhaustive (and does not pretend to be), since it is based on the detection of frequently observed patterns (replacing "and" by "&" or "Jl." by "Journal" in journal names, look for source differing only by one characters, etc), and can always be improved upon.
Bibliographic Coupling Networks & Clusters
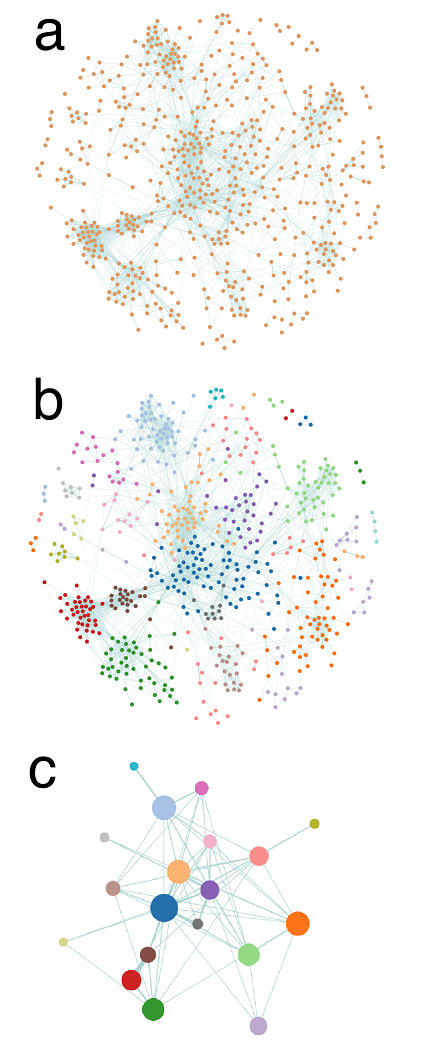
Cluster detection on a BC network of ∼ 600 publications.
Network construction: Bibliographic Coupling (BC) is based on the degree of overlap between the references of each pair of publications. Specifically, BC is performed by computing Kessler' similarity between publications: ωij=Rij/√(RiRj), where Rij is the number of shared references between publications i and j and Ri is the number of references of publication i. If two publications do not share any reference, they are not linked; if they have identical references, the strength of their connexion is maximal. On Fig. a, each node represents a publication, and the thickness of a link is proportional to the similarity between two publications. On this figure and the next, the layouts are determined by a force-based spatialisation algorithm (ensuring that strongly linked nodes are closer to each other).
Cluster detection: a community detection algorithm based on modularity optimization (we use an implementation of the Louvain algorithm) is applied to partition the publications into clusters. Basically, the algorithm groups publications belonging to the same "dense" - in terms of links - region of the BC network, cf Fig. b. The quality of the cluster partitioning can be quantified by the modularity Q, a measure comprised between -1 and 1. The higher it is, the more meaningful the partitioning.
Cluster representation: publications belonging to the same cluster are gathered into a single node, or circle, whose size is proportional to the number of publications it contains, cf Fig. c. A standard frequency analysis is then performed to characterise each cluster with its more frequent / significant items (keywords, references, authors, etc), which can then be used as automatic labels.
Hierarchical clustering: the exact same methodology can be applied to the subsets of publications belonging to each detected cluster to split them into sub-clusters.
What are the advantages of BC analysis? Compared to what happens in co-citation analysis (the other main bibliographic technique, linking publications that are cited together in other publications), the membership of a given publication in this or that cluster is immediate: it is determined by the references used by the authors and does not depend on how the publication will be cited later. In that respect, BC is - among other things - a relevant technique to detect emerging communities.
Visualisation tools
Interactive list of publications
| Filter Corpus | ||
| Sort by |
The Corpus Description dashboard
The corpus description dashboard allows you to explore the frequency distributions of different metadata within the studied corpora. The dashboard is separated in three parts: controls, list view, graph view. You may choose which field you want to explore (keywords, reference, journals, authors, etc) and which type of graph you want to display. Be aware that there is a difference between the "Authors' Keywords" - given by the publications' authors, and the "Keywords", which are build by Scopus based on an analysis on the authors' keywords, the title and the abstract. In most cases, Scopus's keywords are more consistent/normalized/exhaustive. You should also be careful not to lean too much on the keywords to buit your representation of the nature of a corpus since keywords are not available or existing for all the publications. For example, in the "layer 1" corpus, there are no (Scopus) keywords in the metadata of about 81% of the publications, and no authors' keywords in the metadata of about 30% of them.
Thematic maps
The Thematic Maps tool to visualize & explore the results of the BC analysis performed on each corpus. Note that it is usual to consider that the partitions yield by the community detection algorithm are meaningful for values of modularity above Q=0.3-0.4n which is only the case for the "Layer 2" and "Layer 3" corpora. You may refer to our paper for more details on the interpretation of these results, but the quick interpretation is that
- in the "Core publications" and "Layer 1" corpora, we try to force a partition on publications dealing with the narrow concept of instrumental orchestration, in the disciplinary sense, meaning that IO is a core concept⇒ the obtained partitions are hardly relevant.
- in the "Layer 2" corpus and even more in the "Layer 3" corpus, we zoomed out of the Instrumental Orchestration concept and deal more with broader range of concept of research in (mathematical) education: collaborative learning, learning design, etc... Instrumental Orchestration appear mostly in a single, well defined cluster surrounded by other clusters. ⇒ We get to see here other concepts that are independant from but closely related to Instrumental Orchestration.
Team
| Paul Drijvers | Lead researcher, Utrecht University | |
| Sébastian Grauwin | Data scientist, Université de Lyon, ENS de Lyon | |
| Luc Trouche | Lead researcher, Université de Lyon, ENS de Lyon | |