EducMap: Exploring maps of scientific publications from the field of research in education
Context
The EducMap project aims at a better understanding of the scientific communities working in the field of research in education through the exploration of maps of the scientific production created thanks to bibliometric clustering techniques. So far, about 250000 publications published between 2000 and 2018 and found in about 400 sources have been included in the analysis. The interactive visualisations presented below allow to explore the authors, thematics, journals, keywords, cited references, etc involved in the multidisciplinary field of education.
Publications:
- Lund K, Jeong H, Grauwin S & Jensen P (2015). A Scientometric Map of Global Educational Research. Working paper.
- Lund K, Grauwin S, Jensen P, Rozencwajg R, Picard E, Jeong H, Fiore S (2017). Using Scientometric Visualizations to Bridge Disciplinary Boundaries in Research on Education. ICPS (International Convention of Psychological Science) 2017 Conference.
- Lund K, Jeong H, Grauwin S, Jensen P (2017). Une carte scientométrique de la recherche en éducation vue par la base de données internationales Scopus. Les Sciences de l'Éducation - Pour l'Ère nouvelle 50 (1), 67-84.
- Jeong H, Kim J, Lund K, Grauwin S (2019). Computer-Supported Collaborative Learning and Learning Sciences Research in EducMap. ISLS (International Society of the Learning Sciences) 2019 Conference.
Links:
- Ressources (including slides and audio files) from a series of seminars held in 2014 that launched the Educmap project within the ENS Lyon.
- Official presentation of the project on the website of the Laboratoire de l'Éducation of the ENS Lyon.
- Digital Promise, an american nonprofit organisation aiming at providing education practionners with research findings that can inform their work, developped their Research Map project using the method and tools used for EducMap, albeit on different sets of data. They also developped a series of ressources (videos, commentaries, etc) they connected to the themes emerging from the bibliographic analysis.
- The analysis and visualisations were created with BiblioTools/BiblioMaps, a freely available software.
Studied Corpus
Corpus selection
The bibliographic data were extracted from Scopus, one of the widest ressource for bibliographic metadata covering all fields of science. Scopus' coverage of the Social Sciences, while among the best among the database providing such extensive metadata, is not perfect and some biases exist (e.g. an under-representation of non-english publications). What we study may thus not be the "whole existing literature on Education", but rather the "easily available literature on Education for an international audience".
"Education" corpora on successive 5-years periods.
We studied Scopus publication records from about 400 journals listed as relevant in the field of research in education by the AERES, the French national agency for the evaluation of research and higher education. We focused on successive 5-years periods:
- EducMap 2000-2004: corpus of about 37,000 publications, extracted in January 2015.
- EducMap 2005-2009: corpus of about 58,000 publications, extracted in January 2015.
- EducMap 2010-2014: corpus of about 76,500 publications, extracted in January 2015.
- EducMap 2015-2018: corpus of about 75,000 publications, extracted in October 2019 (temporary 4-years period corpus, to be updated in Spring 2020).
"Social Sciences" corpus.
To study the position of the research in education within the whole field of Social Sciences, we also extracted a corpus of publications records within the Scopus Social Sciences & Humanities broad category, limiting it to one year to keep the size of the dataset manageable.
- SocioMap 2000: corpus of about 123,000 publications, extracted in January 2015.
The CORPUS DESCRIPTION interface
1 | Explore different items and their use. Customized visualizations (networks, pie charts, maps, word clouds, etc) allow to best grasp the nature of the corpus. |
2 | View results instantly sorted by record count or alphabetically. |
3 | Interact with the customized visualisation by hovering over an element to view its label and uncover its relationshipwith other elements. |

Be aware that the corpus can be charaterized with different types of keywords, which are not always available for all publications.
- "Authors' Keywords", given by the publications' authors, are e.g. only available for about 70% of the publications within the EducMap 2010-2014 corpus.
- "Keywords", which are build by Scopus based on an analysis on the authors' keywords, the title and the abstract, are e.g. only available for about 20% of the publications within the EducMap 2010-2014 corpus.
- "Title words", build by us from the words of the publications' titles (simply removing stop-words), are available for almost all publications.
⇒ You should be careful not to lean too much on the keywords to built your mental representation of the nature of a corpus, especially when the keywords are only available for a fraction of the publications.
Thematic Maps
Bibliographic Coupling Networks & Clusters
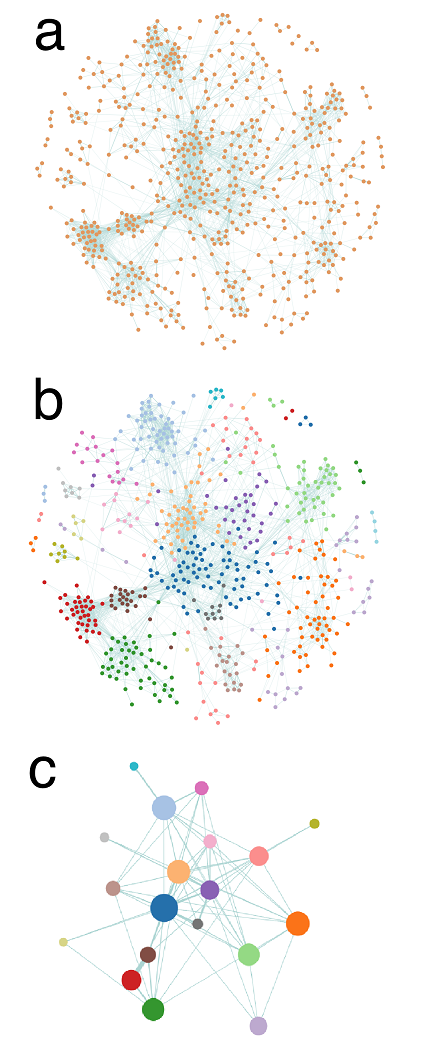
Cluster detection on a BC network of ∼ 600 publications.
Network construction: Bibliographic Coupling (BC) is based on the degree of overlap between the references of each pair of publications, computed via the similarity ωij=Rij/√(RiRj), where Rij is the number of shared references between publications i and j and Ri is the number of references of publication i. If two publications do not share any reference, they are not linked; if they have identical references, the strength of their connexion is maximal. On Fig. a, each node represents a publication, and the thickness of a link is proportional to the similarity between two publications. On this figure and the next, the layouts are determined by a force-based spatialisation algorithm (ensuring that strongly linked nodes are closer to each other).
Cluster detection: a community detection algorithm based on modularity optimization (we use an implementation of the Louvain algorithm) is applied to partition the publications into clusters. Basically, the algorithm groups publications belonging to the same "dense" - in terms of links - region of the BC network, cf Fig. b. The quality of the cluster partitioning can be quantified by the modularity Q, a measure comprised between -1 and 1. The higher it is, the more meaningful the partitioning.
Cluster representation: publications belonging to the same cluster are gathered into a single node, or circle, whose size is proportional to the number of publications it contains, cf Fig. c. A standard frequency analysis is then performed to characterise each cluster with its more frequent / significant items (keywords, references, authors, etc), which can then be used as automatic labels.
Hierarchical clustering: the exact same methodology can be applied to the subsets of publications belonging to each detected cluster to split them into sub-clusters.
What is the goal of BC analysis? Assuming that publications sharing (more) references are thematically close(r), the heuristic of BC clustering is to partition a corpus of publications into groups corresponding to scientific topics.
What are the advantages of BC analysis? Compared to what happens in co-citation analysis (the other main bibliographic technique, linking publications that are cited together in other publications), the membership of a given publication in this or that cluster is immediate: it is determined by the references used by the authors and does not depend on how the publication will be cited later. In that respect, BC is - among other things - a relevant technique to detect emerging communities.
The THEMATIC MAPS interface


Position of Education within the Social Sciences (in 2000)
What is the position of Education within the Social Sciences? The SocioMap 2000 shows that the field of Social Sciences is very diverse, going from topics related to Economics, Management, Behavioral Sciences or Psychology. Some of the clusters in this map are also obviously related to Education. To investigate the relationships between Education and Social Sciences, we take here a closer look at the SocioMap 2000 clusters having more than 30% of their publications in our "Education" corpus. The interactive visualisation below allows to explore how these clusters are related to those from EducMap.
- Check the publications OUT of our "Education" corpus: how many are there, in which journals are they published?
- Check the publications IN our "Education" corpus: how are they related to the "EducMap" clusters?
Multidisciplinary indicator
The scattering of education clusters over multiple disciplinary areas of the Social Sciences and Humanities corpus suggests that research in education is quite multi-disciplinary and wide-reaching, in that different intellectual traditions and areas of study coexist in a loosely connected fashion. One way to measure this scattering is to look at the subtopic clusters and to qualify whether these subtopic clusters gather articles from different Scopus subject areas or not. We quantify this scattering with a multidisciplinary indicator \( M(d_1, d_2) \), which measure the co-presence of two Scopus subject areas \(d_1\) and \(d_2\) within subtopic clusters. Formally:
\( M(d_1, d_2) = \sum_i[f_i(d_1)*f_i(d_2)*S_i] / \sum_i[f_i(d_1)*S_i] \)
where \(f_i(d)\) represents the percentage of articles of Scopus subject area d within subtopic cluster \(i\) and \(S_i\) is the size of subcluster \(i\) (its number of publications). This indicator computes the proportion of articles of Scopus subject area 2 for the clusters where there are articles of Scopus subject area 1 (i.e. \(f_i(d_1)\) is not 0), weighting the contributions by the number of articles of \(d_1\) (the factor \(f_i(d_1)*S_i\))
The figure below show the value of this Multidisciplinary Indicator for the main Scopus subject areas present in the SocioMap data: "Business, Management and Accounting", "Decision Sciences", "Economics, Econometrics and Finance", "Medicine", "Psychology". We added "Education" for those articles published in the list of education journals we built (the Education subject area does not exist in Scopus). The interpretation of this indicator is discuss at more length in one of our publication [link to be added later].
Team
| Kris Lund | Lead researcher (Education expert), Université de Lyon, ENS de Lyon, France. |
| Heisawn Jeong | Researcher (Education expert), Hallym University, Seoul, South Korea. |
| Pablo Jensen | Researcher (Bibliometrics expert), Université de Lyon, ENS de Lyon, France. |
| Sébastian Grauwin | Lead Data scientist (Bibliometrics expert) & web developer, Lyon, France. |
Credit also goes to Isabelle Sperano and Anna Schroeder, from the Departement of Design Studies of the MacEwan University of Edmonton (Canada), who were not directly involved in the EducMap project but contributed to the design of the interfaces and created the illustrations of this home page.